Compare Inflation Protection Options
The following graphs compare monthly premium and daily benefit amounts over time for purchase ages 50 and 65 for the 3% automatic compound inflation option (ACIO) and future purchase option (FPO).
These graphs only illustrate the first 30 years of premium and benefits. The premium lines in these graphs are for comparison only and are meant to indicate that premiums will not automatically increase every year when benefits automatically increase. This does not mean that premiums will never increase for enrollees with ACIO. The underlying premium rates for both ACIO and FPO are not guaranteed.
The effect of FPO on your premium and benefit cannot be predicted, since it is based on a variable rate (the U.S. Department of Labor's Consumer Price Index for All Urban Consumers [CPI-U]). It is important that you understand and are comfortable with this aspect of the FPO before you elect it.
Premiums
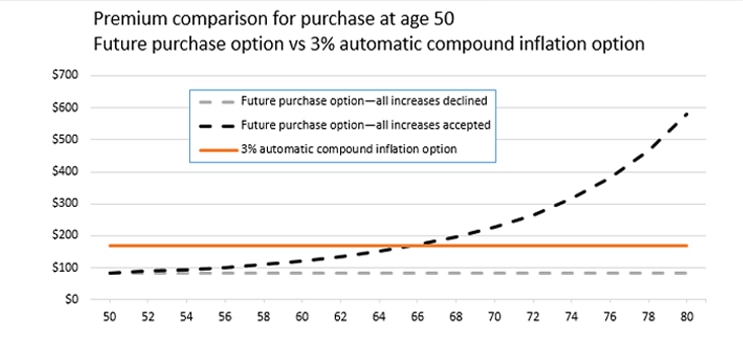
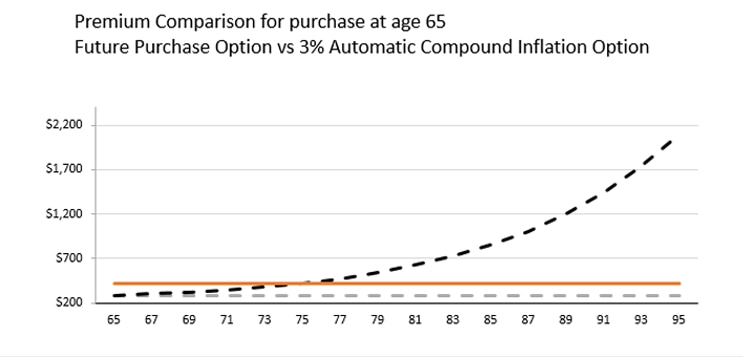
A 3% ACIO premium does not increase automatically each year when the benefit increases. With FPO, premium starts out lower than with 3% ACIO. But, as the benefit increases, the FPO premium increases and eventually becomes greater than the 3% ACIO premium. Because the FPO premium increases steeply during normal retirement ages, you should consider whether you will be able to afford the higher premium under the FPO.
If you decline an FPO increase, your coverage doesn't end, your daily benefit amount just does not increase. If you decline a total of three FPO increases and you later wish to resume receiving increases, you must provide, evidence of your good health that is satisfactory to us.
Age 50
Age 65
Daily Benefit Amount
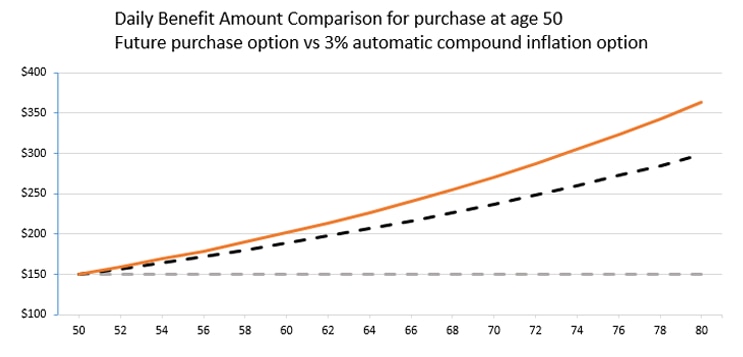
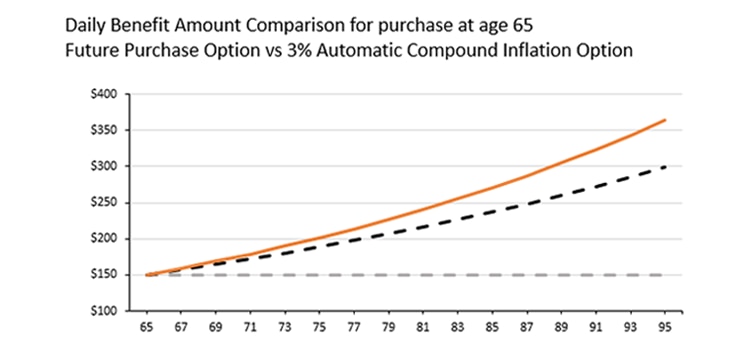
The daily benefit amount increases over time under 3% ACIO and would increase under FPO if similar benefit increases were to take effect. However, if you decline an FPO increase, your FPO benefit will not increase and over time may become substantially less than the 3% ACIO benefit.
Age 50
Age 65
Assumptions
These graphs assume an initial daily benefit amount of $150, a 90-day waiting period, and a five-year benefit period.
Your actual daily benefit amount may vary depending on the rounding of increases each year. When your daily benefit amount is adjusted based on the inflation that you selected, the resulting amount may not be in whole dollar increments since each is rounded to the nearest penny.
Each chart above compares scenarios for FPO and ACIO. For FPO illustrative purposes, we are using a 2.32% annual rate of inflation, based on the CPI-U average annual increase over the past 30 years. The FPO benefit amounts within each chart are calculated assuming you either declined or accepted an FPO offer every two years. For ACIO, the 3% rate will be used to calculate the annual increases to your benefit amount. In reality, FPO increases are offered every two years and can be higher or lower than ACIO rates under the FLTCIP in any given year. Actual FPO premiums and benefits will vary depending on actual future inflation rates.
For detailed information about the two inflation protection options, refer to the FLTCIP 3.0 Outline of Coverage in Book One: Program Details and Rates.